Northwestern Mutual Infographic
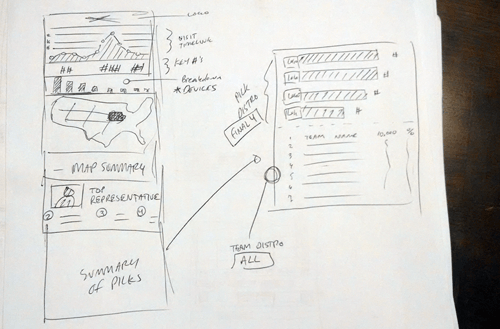
Initial sketches created for the infographic.
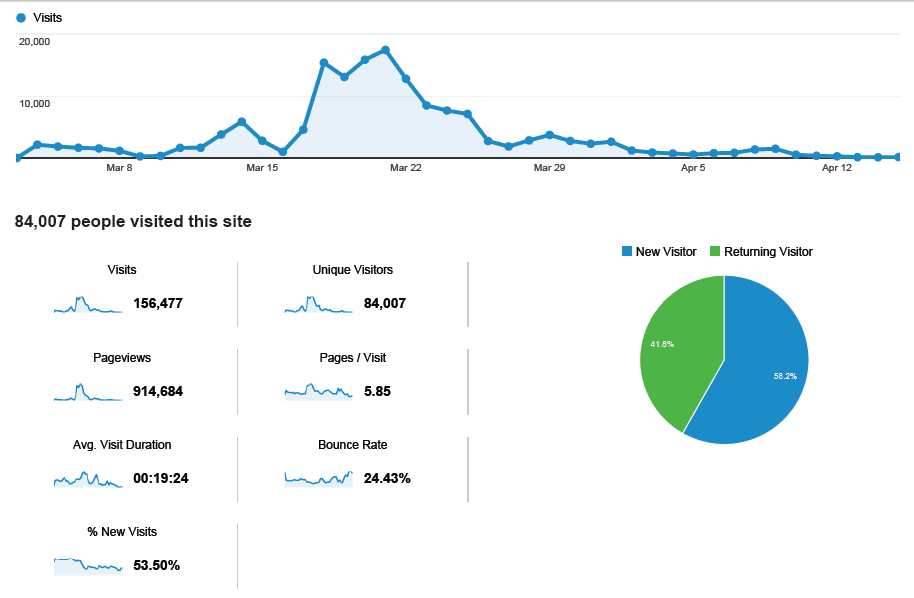
Example of data being analyzed.
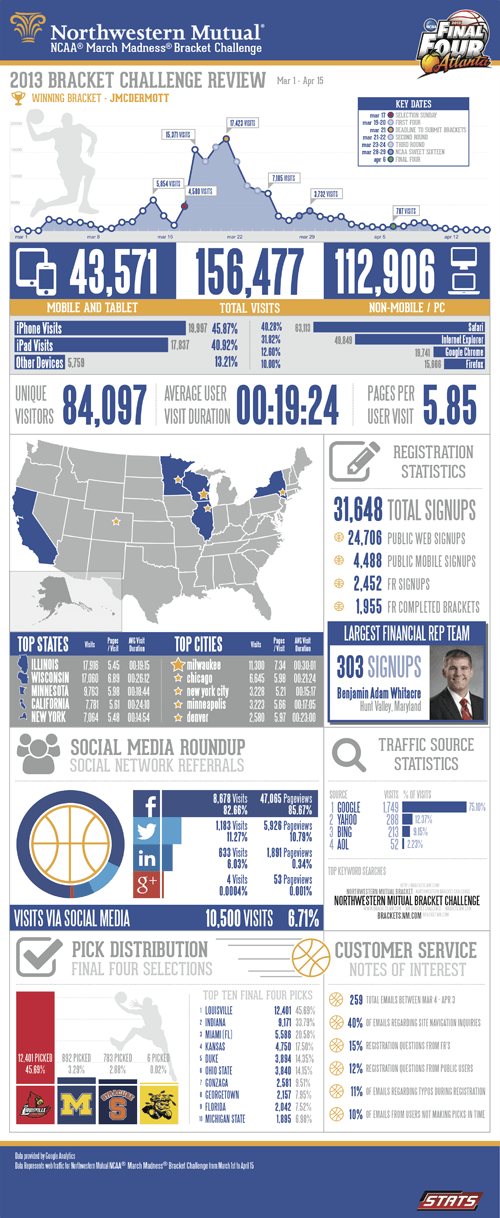
Finished infographic.
After building a unique NCAA Men's Basketball bracket for the client Northwestern Mutual, I created a custom graphic visualizing an overview of the performance of the game. I performed the data mining from Google Analytics and created the infographic from scratch, while also performing statistical analysis. The infographic vizualizes the impact of the fantasy game, including: device usage, access logs, unique visitors, popular choices, and much more.
Finalized version can be found here: Northwestern Mutual Infographic
Skills Applied
- Adobe Photoshop
- Adobe Illustrator
- Information Architecture
- Data Mining
- Statistical Analysis